

Real dealership workforce data, straight from payroll.
This isn’t a survey. It’s twelve months of payroll, HR and time clock records from 1,238 dealerships: more than 100,000 employees paid and 2.5 million punches in a single month. Here’s what the records show about turnover, overtime, pay mix and back-office work.
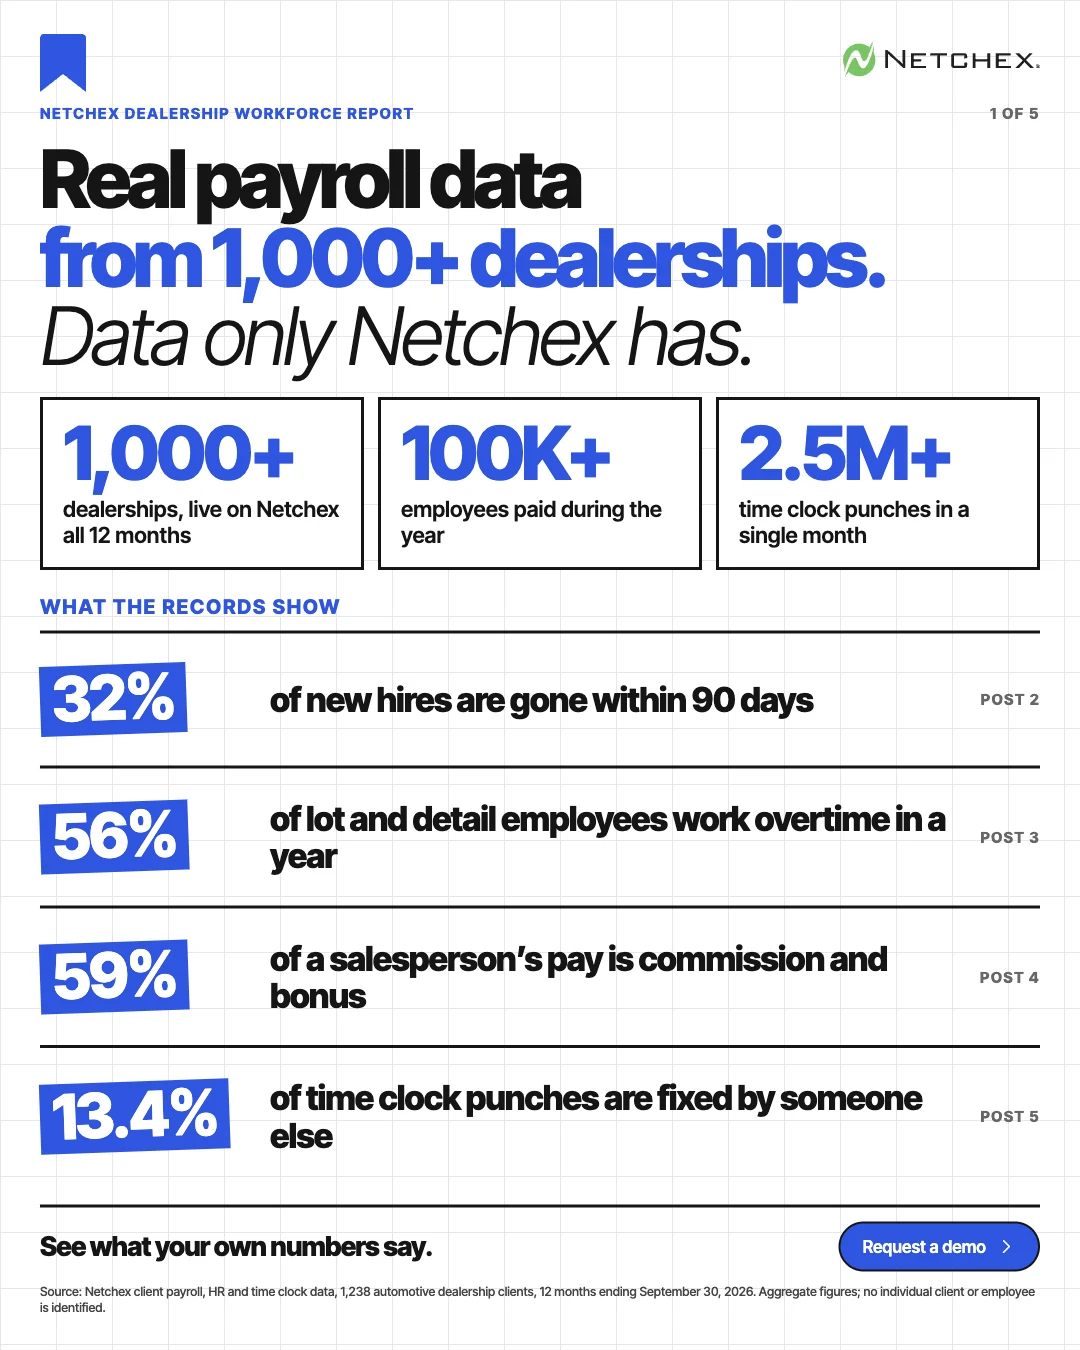
Four numbers worth knowing.
Each one comes from the same set of Netchex dealership clients, measured over the 12 months ending September 30, 2026. Jump to the one you care about.
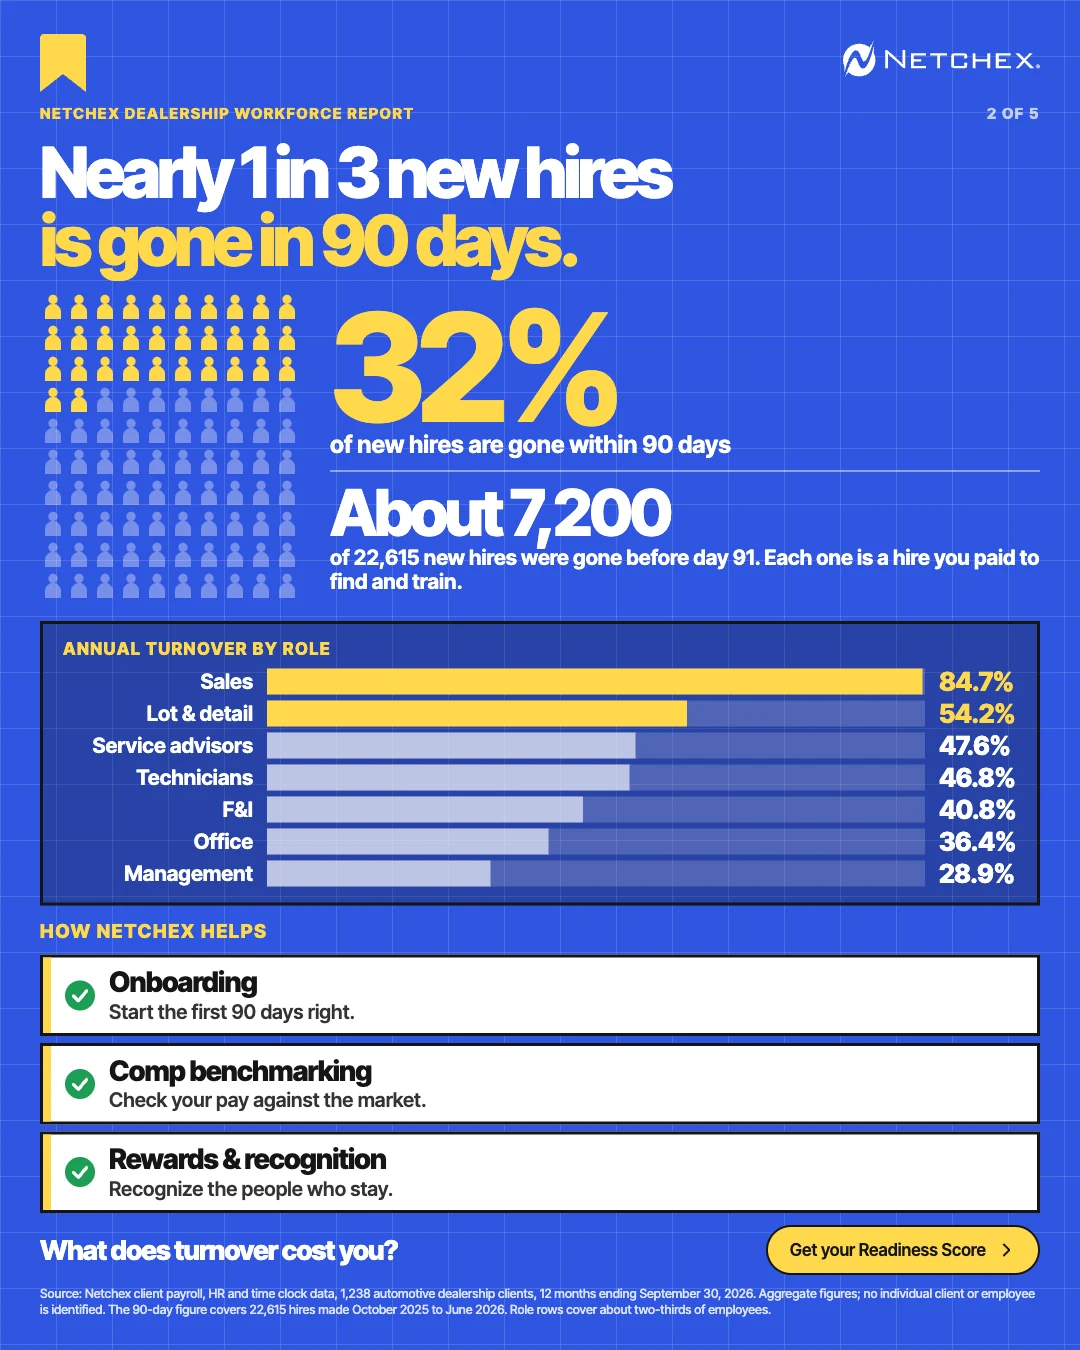
Nearly 1 in 3 new hires is gone in 90 days.
Of 22,615 people hired between October 2025 and June 2026, about 7,200 were gone before day 91. Each one is a hire you paid to find, onboard and train. And the churn isn’t spread evenly.
- Sales turnover runs 84.7% a year, the highest of any role. Lot and detail is next at 54.2%.
- Service advisors (47.6%) and technicians (46.8%) leave at almost the same rate.
- At least 4 in 10 new salespeople are gone within 90 days.
- Management is the steadiest group at 28.9%. That still means more than 1 in 4 managers leaves in a year.
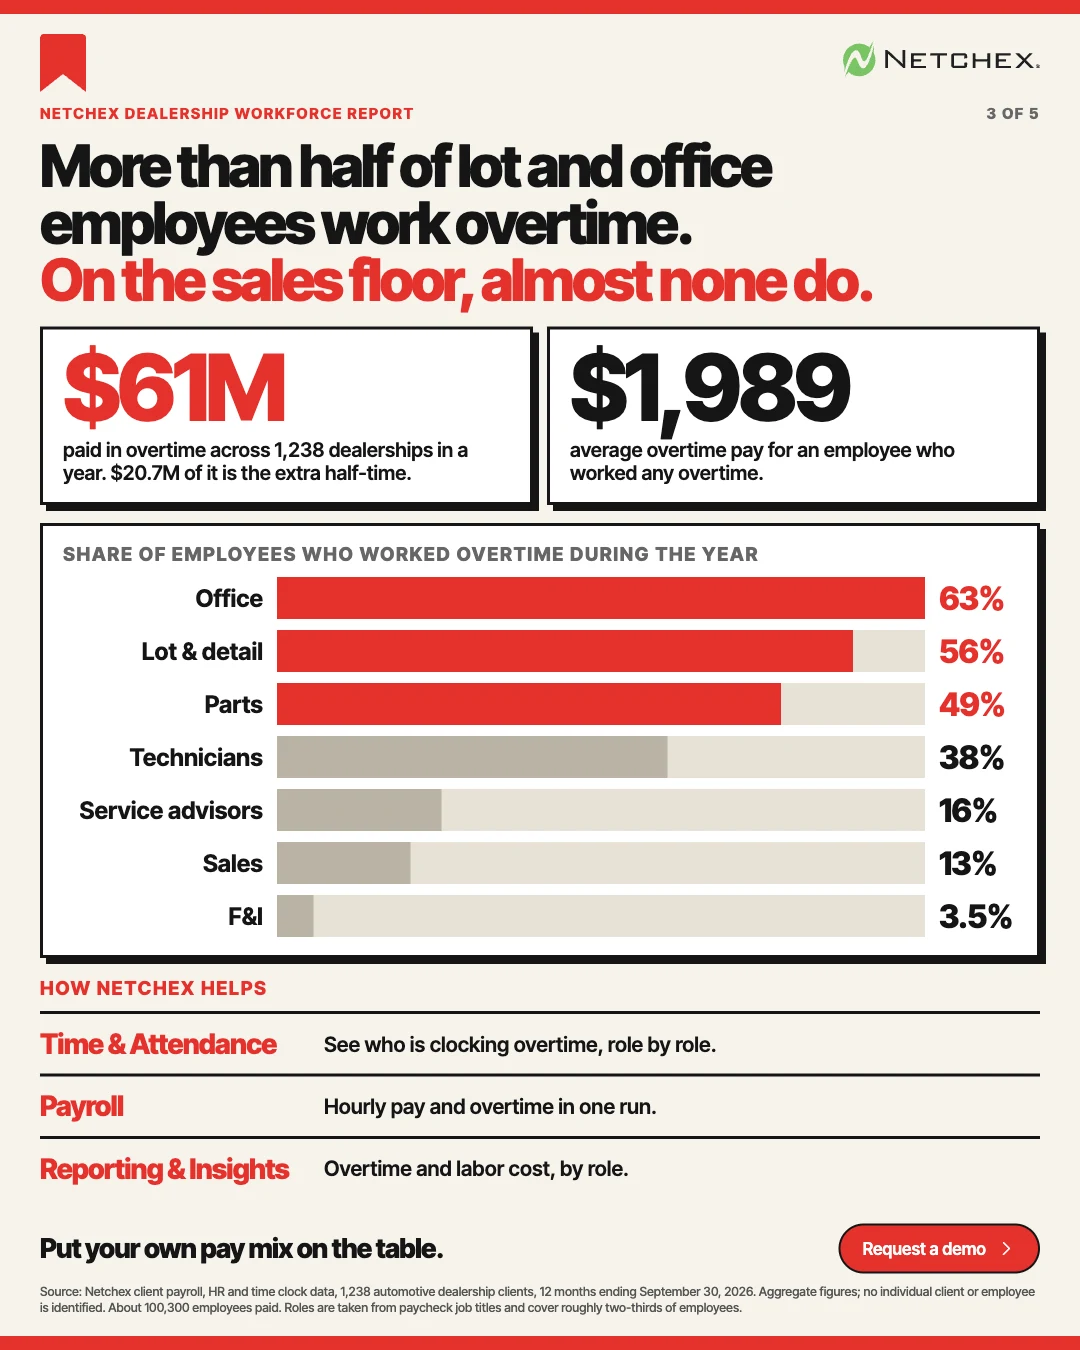
More than half of lot and office employees work overtime. On the sales floor, almost none do.
Overtime lives in the hourly roles. Commission-paid roles almost never log it. If you manage labor cost across the whole store, those two groups need different eyes on them.
- Office 63%, lot and detail 56%, parts 49% and technicians 38% worked overtime during the year.
- Service advisors (16%), sales (13%) and F&I (3.5%) rarely do.
- The extra half-time alone came to about $20.7 million across the 1,238 dealerships.
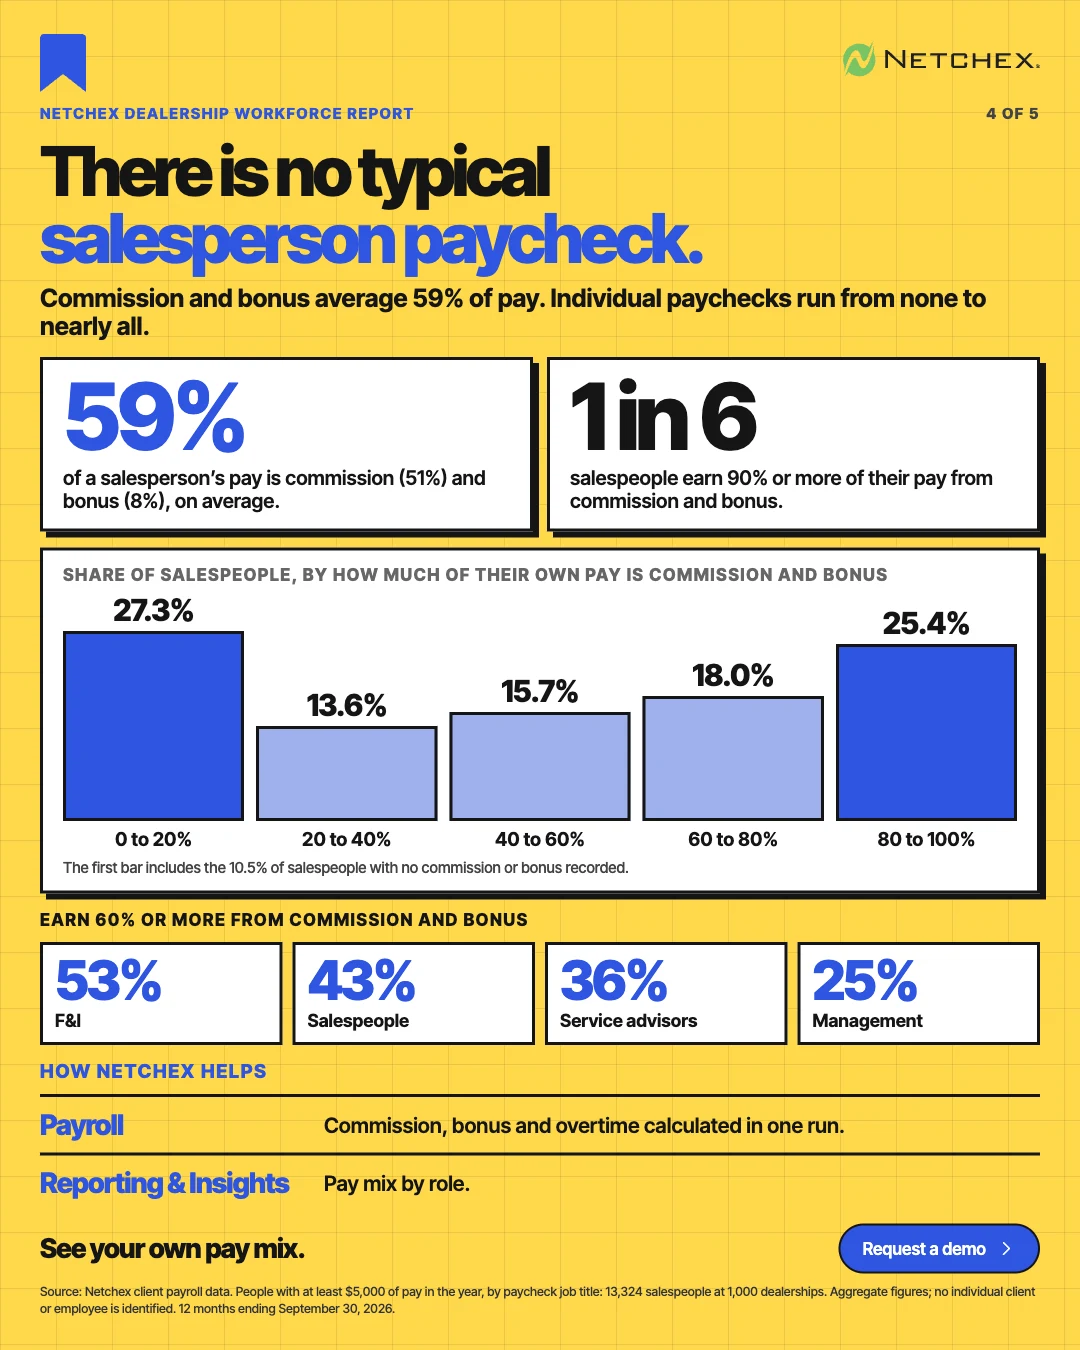
There is no typical salesperson paycheck.
Commission and bonus average 59% of a salesperson’s pay. The average hides the spread: individual paychecks run from none to nearly all.
- 1 in 6 salespeople earns 90% or more of their pay from commission and bonus.
- 27.3% earn under 20% that way, including the 10.5% with no commission or bonus recorded at all.
- Share who earn 60% or more from commission and bonus: F&I 53%, salespeople 43%, service advisors 36%, management 25%.
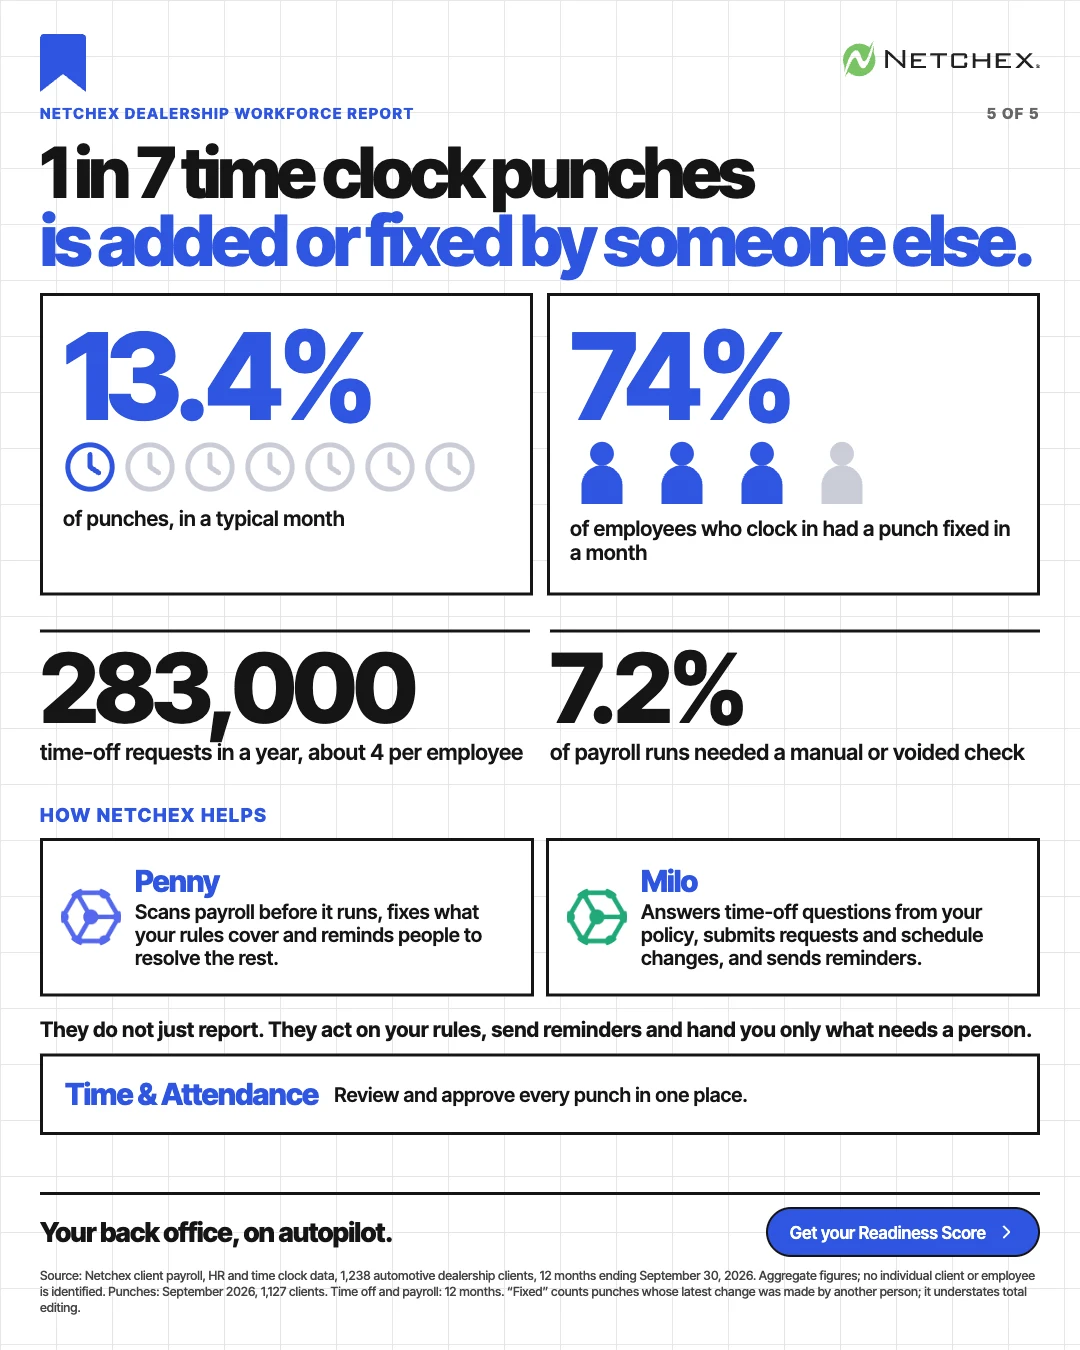
1 in 7 time clock punches is added or fixed by someone else.
In September 2026, 13.4% of punches were added or last changed by someone other than the employee. That’s 337,553 of about 2.5 million. It adds up to a lot of manager and payroll time spent chasing corrections.
- 74% of employees who clocked in had at least one punch fixed in the month.
- Employees filed about 283,000 time-off requests in a year, roughly 4 per employee.
- 7.2% of payroll runs needed a manual or voided check, and 69% of dealerships had at least one.
Where the numbers come from.
All figures are aggregate Netchex client data. No individual dealership or employee is identified.
Who’s in the data
1,238 Netchex dealership clients that were live for the full 12 months ending September 30, 2026. About 100,300 employees were paid during the year.
What it isn’t
It isn’t a random sample of U.S. dealerships. It describes the dealerships Netchex serves, so read it as a picture of them rather than the whole industry.
Roles and 90-day figures
Roles come from paycheck job titles and cover about two-thirds of employees. The 90-day figure covers 22,615 hires made October 2025 to June 2026. Role-level 90-day rates are floors.
Time clock and time off
Punch figures cover September 2026 across 1,127 clients. Time-off and payroll-run figures cover the 12 months. Turnover excludes transfers within a dealer group.


